Business Intelligence

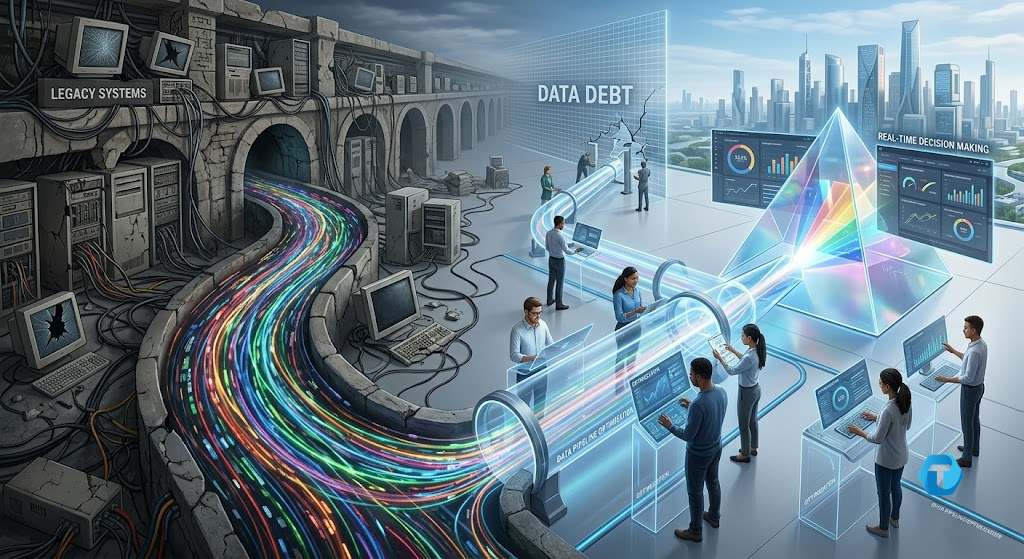
Data pipeline optimization and real-time data streaming architecture graphic
Technology & Innovation

Tackling Data Debt: A Strategic Blueprint for Data Pipeline Optimization and Real-Time Decision Making

Tackling Data Debt: A Strategic Blueprint for Data Pipeline Optimization and Real-Time Decision Making Every scaling enterprise eventually reaches a critical tipping point where its most valuable asset becomes its primary operational bottleneck. You see it in executive dashboards that take hours to refresh, cloud infrastructure invoices that balloon without explanation, and data engineering teams spending eighty percent of their week patching broken ETL scripts. This silent accumulation of architectural band-aids, shortcut queries, and unmonitored dependencies is what technical leaders call data debt. For Chief Data Officers, Lead Data Engineers, and BI Managers, data debt is not merely a backend inconvenience—it directly hampers your company’s ability to capitalize on fresh operational signals. When marketing needs immediate insights on campaign conversions, or risk management demands sub-second fraud detection, legacy batch infrastructure collapses under the pressure. Our team at Techotd frequently meets enterprise leaders whose analytics stacks were built for yesterday’s daily batch routines rather than today’s event-driven demands. Eliminating this structural drag requires a comprehensive strategy centered on data pipeline optimization—turning fragile, slow processing flows into resilient, low-latency pipelines that power confident, real-time decision making across the business. The Invisible Drag of Data Debt on Modern Engineering Teams Data debt rarely accumulates overnight during a single catastrophic project failure. Instead, it creeps into enterprise systems through dozens of everyday tactical compromises. A marketing team requests an urgent ad-hoc report, so a developer writes a quick SQL script directly against a production database. Six months later, four downstream dashboards and two financial reporting tools quietly depend on that unmonitored, undocumented script. Multiply this pattern across fifty departments and hundreds of microservices, and you inevitably end up with a tangled “spaghetti architecture” that nobody dares to touch. Historically, enterprise data infrastructure relied heavily on traditional night-time batch processing. Relational databases staged raw records, scheduled cron jobs executed heavy SQL transformations during off-peak hours, and pre-aggregated data marts served static morning reports. That model worked well when business operations moved at a daily or weekly rhythm. Today, however, business operations run continuously, and waiting twelve hours for updated inventory levels or user activity logs creates unacceptable competitive lag. When growing enterprises attempt to force legacy batch systems to support real-time demands without undertaking root-cause refactoring, several severe operational pain points surface: Pervasive Data Latency: Crucial business units are forced to make high-stakes choices using stale information. By the time supply chain anomalies, customer churn triggers, or transaction anomalies appear on executive dashboards, the opportunity to mitigate the issue has already passed. Runaway Cloud Infrastructure Costs: Unoptimized SQL transformations running on modern cloud data warehouses without proper partitioning, clustering, or materialization strategies burn through compute credits at an alarming rate. Schema Drift Instability: When upstream application teams modify database schemas without cross-team coordination, downstream pipelines fail silently. This introduces subtle errors into reporting layers and severely damages leadership’s trust in data accuracy. Engineering Fatigue and Turnover: Senior data engineers spend their time firefighting broken jobs, debugging fragile dependencies, and performing manual backfills instead of architecting innovative machine learning capabilities. A structured initiative focused on data pipeline optimization is the only sustainable path out of this cycle. By decoupling ingestion from heavy transformations and removing redundant computation paths, technical leaders can eliminate historical debt while establishing an agile, real-time analytics baseline. How It Works in Practice: Engineering a High-Throughput Real-Time Pipeline Transforming fragile legacy data flows into robust, continuous pipelines requires moving away from rigid, monolithic batch jobs toward an event-driven, decoupled processing model. When our architects at Techotd evaluate enterprise data platforms, we emphasize modularity, horizontal elasticity, and strict data contracts right at the point of ingestion. Here is how modern high-throughput architectures function in production: 1. Event-Driven Ingestion and Change Data Capture (CDC) Rather than executing resource-intensive polling queries against production transactional databases every night, modern architectures capture record changes in near-real-time. Using  and distributed streaming platforms like Apache Kafka or Redpanda, operational events—such as a completed order or an updated customer profile—are published to dedicated stream topics the moment they occur. This eliminates heavy database locks on operational systems while capturing precise audit histories. 2. Stream Processing and In-Memory Transformations As events flow into the streaming broker, distributed engines like Apache Flink or Spark Streaming transform, validate, and enrich the data on the fly. Instead of landing raw data into storage and running heavy SQL queries later, stream processors compute running aggregates—such as rolling ten-minute transaction totals or dynamic risk scoring—with sub-second latency. 3. Decoupled Storage and Materialization Layers Storage strategies must reflect how downstream applications consume information. Key-value lookups for operational applications should land in ultra-fast caches like Redis or DynamoDB, whereas long-term analytical trends belong in columnar lakehouse storage like Snowflake, BigQuery, or Databricks. Effective data pipeline optimization ensures data is converted into efficient columnar formats like Apache Parquet or Iceberg before hitting storage layers. 4. Idempotency and Pipeline Observability Continuous pipelines must tolerate network blips, late-arriving events, and schema changes without crashing. Building pipelines for idempotency guarantees that processing the exact same event multiple times yields identical final states. Furthermore, incorporating automated data observability into your data pipeline optimization strategy allows engineering teams to track end-to-end data lineage, detect schema drift instantly, and flag quality anomalies before they impact business users. +————————–+ | Operational Databases | +————————–+ | v (CDC / Debezium) +————————–+ | Apache Kafka Topics | +————————–+ | v +————————–+ | Apache Flink Stream Ops | +————————–+ | +——+——+ | | v v +———–+ +————+ | In-Mem | | Columnar | | Cache | | Lakehouse | +———–+ +————+ Strategic Impact & Measurable Value for Executive Leaders Refactoring your core data infrastructure is far more than a technical housekeeping project; it directly transforms enterprise operational economics and market agility. For Chief Data Officers and BI Managers, investing in systematic data pipeline optimization converts back-office engineering improvements into direct financial savings and strategic advantages. Consider the tangible executive value achieved through modernized pipeline architectures: Significant Infrastructure Spend Reduction: By eliminating duplicate data processing routes, optimizing query execution logic,

Artificial Intelligence, Business Analytics, enterprice

The Impact of Agentic AI on Enterprise Productivity

The Impact of Agentic AI on Enterprise Productivity Artificial Intelligence has evolved rapidly over the past few years. What started as chatbots, recommendation engines, and predictive analytics has now entered a new phase known as Agentic AI. Unlike traditional AI systems that primarily respond to commands or analyze data, Agentic AI can independently plan, execute, monitor, and optimize tasks to achieve specific goals. As organizations continue their digital transformation journeys, Agentic AI is emerging as one of the most influential technologies reshaping enterprise productivity. Businesses are no longer looking at AI merely as a tool that assists employees; instead, they are deploying AI agents capable of acting as digital workers that can handle complex workflows with minimal human intervention. From customer service and IT operations to finance, marketing, and supply chain management, Agentic AI is helping enterprises operate more efficiently, reduce costs, improve decision-making, and unlock new levels of productivity. As we move through 2026, companies across industries are recognizing that the future of work will involve close collaboration between humans and autonomous AI agents. Understanding Agentic AI Agentic AI refers to artificial intelligence systems that possess the ability to act autonomously toward achieving predefined objectives. Unlike conventional AI applications that require constant prompts or supervision, Agentic AI can make decisions, initiate actions, adapt to changing environments, and complete multi-step tasks independently. For example, a traditional AI chatbot may answer customer questions based on available information. An Agentic AI system, however, can handle an entire customer support process—from receiving the request and identifying the issue to processing refunds, updating records, and following up with customers. The key capabilities that distinguish Agentic AI include: Goal-oriented decision-making Autonomous workflow execution Continuous learning and adaptation Multi-step task management Context awareness Integration with enterprise systems Proactive problem-solving These characteristics enable Agentic AI to function more like a virtual employee rather than a simple software application. Why Enterprises Are Adopting Agentic AI Organizations are under increasing pressure to improve efficiency, reduce operational expenses, and maintain competitiveness in rapidly changing markets. Traditional automation solutions can handle repetitive tasks, but they often struggle with complex processes that require decision-making and adaptability. Agentic AI fills this gap by bringing intelligence and autonomy to business operations. Several factors are driving enterprise adoption: Growing Operational Complexity Modern businesses manage enormous volumes of data, processes, and interactions. Human teams often struggle to keep up with increasing complexity. Agentic AI can process information at scale and coordinate multiple tasks simultaneously. Demand for Faster Decision-Making Markets move quickly, and delays can be costly. AI agents analyze data in real time and provide immediate actions or recommendations, helping organizations respond more rapidly to opportunities and challenges. Workforce Productivity Challenges Many industries continue to face talent shortages and increasing workloads. Agentic AI helps organizations maximize productivity without significantly expanding headcount. Cost Optimization Businesses are continuously seeking ways to reduce expenses. AI agents can automate labor-intensive processes, reducing operational costs while maintaining service quality. Digital Transformation Initiatives Organizations investing in cloud computing, analytics, and automation increasingly view Agentic AI as a natural extension of their digital transformation strategies. Workflow Automation Beyond Traditional RPA Robotic Process Automation (RPA) has been used for years to automate repetitive tasks. However, RPA systems generally follow predefined rules and struggle when unexpected situations arise. Agentic AI enhances automation by introducing intelligence into workflows. For example, instead of simply processing invoices according to fixed rules, an AI agent can: Identify anomalies Communicate with vendors Request missing information Resolve exceptions Complete approvals automatically This significantly reduces manual intervention and accelerates business processes. Enhanced Employee Productivity One of the most important benefits of Agentic AI is its ability to augment human workers. Employees often spend significant time on administrative tasks such as: Data entry Scheduling Reporting Documentation Research Information retrieval AI agents can handle these responsibilities, allowing employees to focus on strategic, creative, and high-value work. Rather than replacing workers, Agentic AI often acts as a productivity multiplier, enabling teams to accomplish more with the same resources. Faster Decision-Making Data-driven decision-making has become essential for modern enterprises. However, analyzing large datasets can be time-consuming. Agentic AI systems continuously monitor: Market trends Customer behavior Operational performance Financial metrics Supply chain activities They can identify patterns, generate insights, and recommend actions in real time. Executives and managers benefit from faster access to actionable intelligence, improving organizational agility and responsiveness. Improved Customer Service Operations Customer experience has become a major competitive differentiator. Agentic AI is transforming customer support by enabling intelligent automation. AI agents can: Resolve support tickets Handle account updates Process refunds Schedule appointments Escalate complex issues Follow up with customers Because these systems operate around the clock, businesses can provide faster and more consistent service while reducing support costs. Knowledge Management and Information Access Large enterprises often struggle with fragmented information spread across multiple systems. Employees may spend considerable time searching for documents, policies, procedures, and data. Agentic AI can act as an intelligent knowledge assistant that: Retrieves relevant information Summarizes documents Generates reports Provides recommendations Answers internal queries This improves productivity by reducing time spent searching for information. Supply Chain Optimization Supply chain management involves numerous interconnected activities, making it an ideal environment for Agentic AI deployment. AI agents can: Monitor inventory levels Predict demand fluctuations Optimize procurement Coordinate logistics Identify supply chain risks Recommend corrective actions These capabilities help organizations improve efficiency while minimizing disruptions. Financial Operations Efficiency Finance departments often deal with repetitive and time-consuming processes. Agentic AI can streamline activities such as: Invoice processing Expense management Budget forecasting Financial reporting Compliance monitoring Fraud detection As a result, finance teams can focus more on strategic planning and business growth initiatives. IT Operations and Infrastructure Management Enterprise IT environments continue to grow in complexity. Agentic AI is increasingly being used to manage infrastructure and support operations. AI agents can: Detect system anomalies Monitor performance Resolve incidents Apply security updates Allocate resources Predict failures This proactive approach improves system reliability while reducing operational workloads. Marketing and Sales Productivity Marketing and sales teams are

Business Analytics, Business Intelligence, Data Analytics, Digital Transformation

The Role of Data Analytics in Business Growth and Decision-Making

The Role of Data Analytics in Business Growth and Decision-Making For generation after generation, the ultimate business icon was the “gut-instinct executive.” We’ve all seen this character celebrated in business memoirs and biographies—the visionary leader who walks into a high-stakes boardroom, ignores the paperwork, listens to their inner voice, and makes a massive, multi-million-dollar gamble that somehow pays off perfectly. It was a romantic, thrilling way to think about entrepreneurship. But if you peel back the curtain on the businesses that are consistently dominating their industries today, you’ll find that the era of relying entirely on blind gut feelings is officially over. Running a business in 2026 without data analytics is the equivalent of flying a commercial airliner in a dense storm with the windshield blacked out and the dashboard instruments turned off. You might feel like you’re moving in the right direction, but you are structurally blind to the terrain around you. Data analytics isn’t about burying your company under cold, intimidating mountains of mathematical equations or sterile code blocks. At its heart, data analytics is a deeply human pursuit: it is the act of turning raw, chaotic digital footprints into clear, actionable stories. It is the compass that takes the terrifying guesswork out of scaling a business. Let’s dive deep into the real-world role of data analytics, how it reshapes corporate decision-making, and how your enterprise can leverage it to fuel sustainable growth. 1. The Maturity Curve: Moving Beyond the Rearview Mirror Many organizations believe they are practicing data analytics simply because they review a monthly financial statement or track basic website traffic hits. But data analytics isn’t a single, static task; it is a progressive maturity curve. To truly unlock business growth, an organization must transition from looking backward to looking forward. ┌─────────────────────────────────────────┐ │ THE DATA ANALYTICS CONTINUUM │ └────────────────────┬────────────────────┘ │ ┌───────────────────┬─────────────┴─────────────┬───────────────────┐ ▼ ▼ ▼ ▼ ┌─────────────────┐ ┌─────────────────┐ ┌─────────────────┐ ┌─────────────────┐ │ Descriptive │ │ Diagnostic │ │ Predictive │ │ Prescriptive │ │ Analytics │ │ Analytics │ │ Analytics │ │ Analytics │ ├─────────────────┤ ├─────────────────┤ ├─────────────────┤ ├─────────────────┤ │ “What happened?”│ │ “Why did it │ │ “What is likely │ │ “How can we │ │ (The Past) │ │ happen?” │ │ to happen?” │ │ make it happen?”│ └─────────────────┘ └─────────────────┘ └─────────────────┘ └─────────────────┘ Phase 1: Descriptive Analytics (“What happened?”) This is the foundational baseline. It compiles historical data to show you the past. It looks like your basic QuickBooks reports, monthly sales totals, or social media engagement tallies. It tells you the state of the union, but it doesn’t explain the underlying mechanics. Phase 2: Diagnostic Analytics (“Why did it happen?”) This phase digs below the surface to uncover anomalies and correlations. If your sales suddenly dropped by 15% in May, diagnostic analytics isolates the variables: it cross-references the drop with a simultaneous technical glitch on your checkout page or a aggressive ad campaign launched by a direct competitor. Phase 3: Predictive Analytics (“What is likely to happen?”) This is where data begins to actively drive growth. By feeding historic patterns and current market variables into statistical models, businesses can forecast future consumer trends, seasonal demand spikes, and inventory constraints with incredible precision. Phase 4: Prescriptive Analytics (“How can we make it happen?”) The absolute peak of the curve. Prescriptive analytics doesn’t just predict a future scenario; it acts as an automated strategic advisor, testing thousands of simulations to recommend the exact business moves, pricing adjustments, or supply chain changes required to optimize your profit margin. 2. Transforming the Boardroom: From Loudest Opinion to Hard Truths We’ve all sat in business meetings that quickly devolved into an exhausting shouting match. The marketing director is convinced the company needs to spend more money on video ads because of a trend they saw online. The sales director insists that discounting the product tier is the only way to hit quarterly targets. Traditionally, the tie-breaking vote went to the HIPPO—the Highest Paid Person’s Opinion. Data analytics completely re-engineers this toxic cultural dynamic. When an organization embraces data fluency, decisions are democratized and stripped of personal ego. Instead of debating unverified assertions, team members bring clean, cross-verified data dashboards to the table. You no longer argue about whether a marketing campaign is “good” or “bad” based on subjective aesthetics. Instead, you look directly at your Customer Acquisition Cost (CAC), Lifetime Value (LTV) ratios, and drop-off points in the sales funnel. Data shifts the corporate focus away from who is right, and centers it squarely on what is right for the customer and the bottom line. 3. The Core Engines of Growth Driven by Analytics When deployed intentionally, data analytics operates as a high-powered engine that accelerates growth across three foundational pillars of your enterprise: Pillar 1: Radical Customer Closeness and Personalization In modern commerce, consumers leave a rich trail of digital breadcrumbs wherever they go. Analytics aggregates these touchpoints—what time they open your emails, how long they hover over a pricing tier, what questions they type into your support chat—to build highly accurate behavioral archetypes. Instead of treating your audience as a single, generic demographic block, you can dynamically tailor your web copy, product bundles, and outreach timing to match an individual’s exact position in the buying journey. This hyper-personalization builds deep customer loyalty and drastically drives up retention rates. Pillar 2: Identifying Hidden Operational Leaks Growth isn’t just about bringing more revenue in through the front door; it’s about stopping capital from quietly leaking out the back door. Operational data analytics continuously audits your internal workflows. It flags delivery trucks that are wasting fuel on inefficient routes, spots manufacturing machinery that is showing signs of mechanical wear before it suffers a costly breakdown, and highlights customer service issues that take up disproportionate team time. Cleaning up these quiet internal inefficiencies instantly maximizes your net margins. Pillar 3: Risk Mitigation and Market Navigation Expanding into a new market, launching a new product line, or altering your pricing strategy is inherently risky. Data analytics functions as a low-cost testing

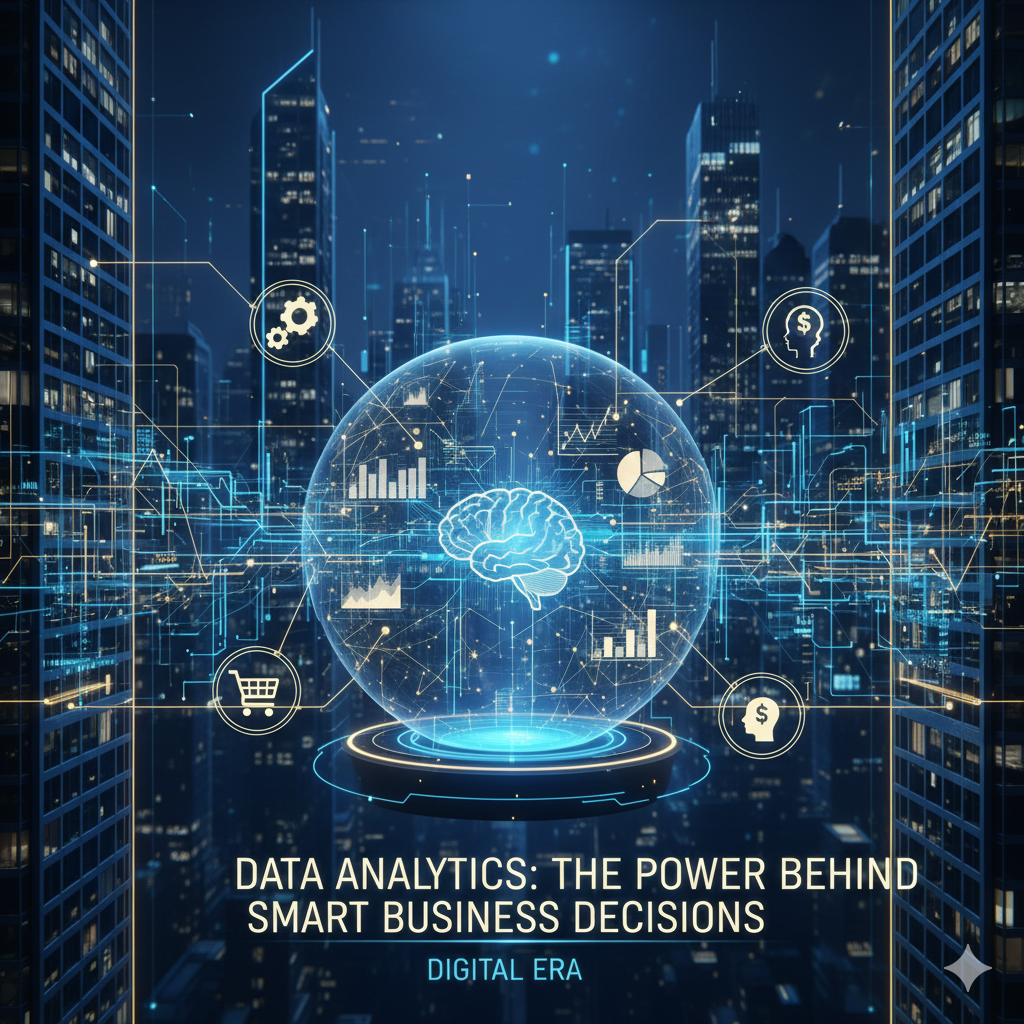
Futuristic digital city with glowing data analytics icons and brain hologram symbolizing smart business intelligence
Data Analytics

The Power Behind Smart Business Decisions in the Digital Era

Introduction In today’s digital-first world, data has become one of the most valuable resources for organizations. From e-commerce and healthcare to banking and education, every industry relies on data to make smarter, evidence-based decisions. Data Analytics bridges the gap between raw information and meaningful insights, empowering businesses to innovate, optimize operations, and predict future trends. What is Data Analytics? Data Analytics is the process of examining raw data to discover patterns, trends, and insights that can help make informed decisions. It involves collecting, cleaning, processing, and interpreting data using statistical and computational methods. Simply put, it helps answer questions like: What happened? Why did it happen? What will happen next? What should we do about it? Why Data Analytics Matters Organizations generate massive amounts of data every day — from customer interactions to online transactions. Data analytics helps transform this chaos into clarity. It enables companies to: Understand customer behavior Optimize marketing strategies Reduce operational costs Improve product quality Predict future market trends Businesses using data analytics are more agile, customer-centric, and profitable compared to those relying solely on intuition. Types of Data Analytics There are four main types of data analytics, each serving a unique purpose: Descriptive Analytics – Answers “What happened?” by summarizing past data. Diagnostic Analytics – Answers “Why did it happen?” by identifying causes and relationships. Predictive Analytics – Answers “What might happen?” using statistical models and machine learning. Prescriptive Analytics – Answers “What should we do?” by suggesting data-driven actions. Key Components of Data Analytics Data Collection: Gathering data from various sources like databases, APIs, and IoT devices. Data Cleaning: Removing inconsistencies, duplicates, and errors to ensure accuracy. Data Processing: Structuring data for analysis using tools and programming languages. Data Analysis: Applying algorithms, visualization, and statistical techniques. Data Interpretation: Turning results into actionable business strategies. Data Analytics Tools and Technologies Some popular tools and technologies include: Excel – Basic analytics and visualization. Python and R – For advanced statistical and machine learning models. Tableau and Power BI – For creating interactive dashboards. Apache Hadoop and Spark – For handling large-scale data. SQL – For querying structured databases. Google Analytics – For web and marketing analytics. Real-World Applications of Data Analytics Retail: Personalized recommendations and inventory optimization. Healthcare: Predicting disease outbreaks and improving patient care. Finance: Fraud detection and credit risk assessment. Manufacturing: Quality control and predictive maintenance. Education: Tracking student performance and customizing learning plans. Sports: Enhancing team performance using real-time stats. Benefits of Implementing Data Analytics Improved decision-making Enhanced customer experience Reduced costs and inefficiencies Increased innovation and competitiveness Real-time monitoring and performance evaluation Challenges in Data Analytics Despite its advantages, data analytics faces several challenges: Data privacy and security concerns Shortage of skilled professionals Integrating data from multiple sources Managing data quality and governance High implementation costs for small businesses Future Trends in Data Analytics Artificial Intelligence (AI) Integration: AI-driven analytics will automate insights. Edge Analytics: Real-time analysis on devices close to data sources. Augmented Analytics: Natural language processing (NLP) for easier data interaction. Cloud-Based Analytics: Scalable and cost-effective solutions for businesses of all sizes. Data Democratization: Empowering non-technical users to make data-driven decisions. Conclusion Data Analytics is no longer a luxury — it’s a necessity for organizations aiming to stay competitive in the digital age. From improving customer engagement to predicting market behavior, it helps businesses make informed, timely, and impactful decisions. As technology evolves, the role of analytics will continue to expand, unlocking even more opportunities for innovation and growth. Top Mobile App Development Frameworks in 2025 FAQs Q1. What is data analytics in simple terms?It is the process of analyzing raw data to find useful information for decision-making. Q2. How is data analytics different from data science?Data science focuses on developing algorithms and models, while analytics focuses on applying those models for business insights. Q3. Which industries use data analytics the most?Finance, healthcare, retail, e-commerce, and manufacturing industries rely heavily on analytics. Q4. What skills are needed for a career in data analytics?Statistical knowledge, Python/R programming, SQL, data visualization, and critical thinking. Q5. Is data analytics a good career option?Yes! It’s one of the most in-demand and high-paying career paths in the tech industry. Q6. What are some free tools to start learning data analytics?Google Analytics, Tableau Public, Power BI (free version), and Excel.

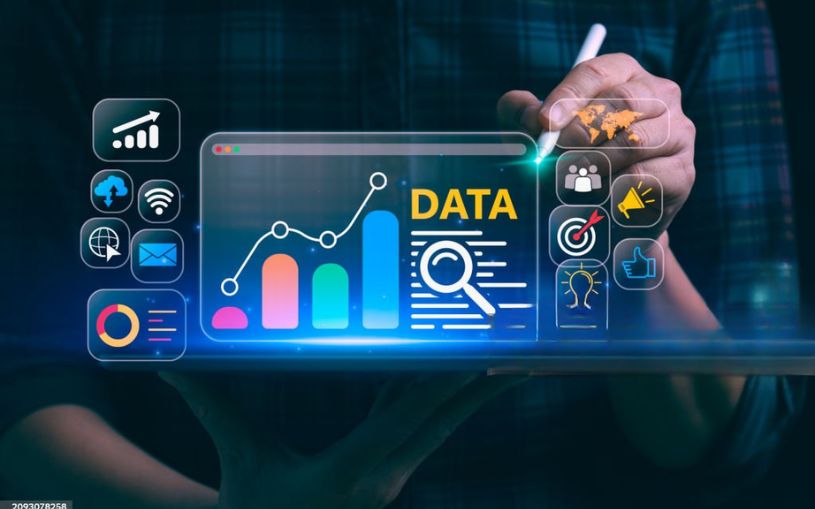
Business Intelligence dashboard visualizing big data analytics trends
Business Intelligence

Big Data Analytics and Business Intelligence: Turning Information into Insight

Introduction In today’s hyper-connected digital world, data is the new oil — a powerful asset that drives innovation, strategy, and growth. Every second, billions of data points are generated from online transactions, social media, IoT devices, and business operations. But raw data is meaningless unless it’s analyzed, interpreted, and used to make informed decisions. That’s where Big Data Analytics and Business Intelligence (BI) come into play. Together, they empower organizations to uncover hidden trends, improve efficiency, and gain a competitive edge in the marketplace. What Is Big Data Analytics? Big Data Analytics is the process of examining large, complex datasets to discover hidden patterns, correlations, market trends, and customer preferences. Unlike traditional data analysis, Big Data Analytics can handle massive volumes (terabytes or petabytes) of structured and unstructured data at lightning speed.  The 5 Vs of Big Data: Volume – Massive amount of data generated daily Velocity – Speed at which data is created and processed Variety – Different formats (text, images, videos, logs, etc.) Veracity – Accuracy and reliability of data Value – Insights gained from analysis By leveraging technologies like Hadoop, Spark, and NoSQL databases, businesses can process and analyze enormous data efficiently. What Is Business Intelligence (BI)? Business Intelligence is a technology-driven process for analyzing data and presenting actionable insights to help executives, managers, and employees make informed business decisions. BI systems typically use dashboards, reports, and visualization tools like: Power BI Tableau QlikView Google Data Studio BI tools collect data from multiple sources, integrate it, and display results through interactive visual dashboards, making insights accessible to everyone. Big Data Analytics vs. Business Intelligence Aspect Big Data Analytics Business Intelligence (BI) Purpose Predict future outcomes Analyze past & present performance Data Type Structured + Unstructured Mostly structured data Tech Used Hadoop, Spark, Machine Learning Power BI, Tableau, SQL Output Predictive & prescriptive insights Descriptive & diagnostic insights Focus Exploration & forecasting Reporting & visualization In short, Big Data Analytics predicts what’s coming next, while Business Intelligence explains what’s happening now. Together, they create a 360° view of the organization, enhancing data-driven strategies. How Big Data and BI Work Together When integrated, Big Data and BI enable organizations to: Collect vast amounts of real-time data Process and store it efficiently Visualize complex patterns Support strategic business decisions Example:A retail company can use Big Data Analytics to predict customer purchase trends and then use BI dashboards to visualize which products are performing best in real-time. Key Components of Big Data and BI Ecosystem 1. Data Collection Data is gathered from multiple sources — sensors, CRM systems, web logs, transactions, and social media. 2. Data Storage Tools like Hadoop Distributed File System (HDFS), Amazon S3, or Google Cloud Storage store massive data volumes securely. 3. Data Processing Frameworks such as Apache Spark and Flink process the data for analysis. 4. Data Analysis Machine learning algorithms and statistical models identify patterns and trends. 5. Data Visualization BI tools like Power BI or Tableau present the results in interactive dashboards and graphs. Applications of Big Data and BI in Industries  1. Retail & E-Commerce Personalized product recommendations Dynamic pricing based on demand Customer behavior tracking Example:Amazon uses predictive analytics to recommend products, improving sales and customer engagement.  2. Healthcare Predictive diagnosis and treatment plans Disease outbreak tracking Patient data management Example:Hospitals use BI tools to monitor patient recovery and resource allocation. 3. Finance Fraud detection using real-time analytics Credit risk assessment Algorithmic trading Example:Banks use Big Data to identify suspicious transactions within seconds. 4. Manufacturing Predictive maintenance of equipment Supply chain optimization Quality control automation 5. Education Performance analytics for students Personalized learning paths Data-driven decision-making in administration Emerging Trends in Big Data and BI Artificial Intelligence Integration:Machine learning models now automate insights generation. Real-Time Analytics:Instant decision-making with live data streaming. Data Democratization:BI tools make analytics accessible to non-technical users. Augmented Analytics:Combines AI and natural language processing (NLP) for smarter reports. Edge Analytics:Data processing closer to the source for faster outcomes. Data Governance and Privacy:Ensuring compliance with regulations like GDPR and HIPAA. Benefits of Big Data Analytics and BI Benefit Impact Informed Decision-Making Data-backed strategic planning Cost Optimization Identify inefficiencies Customer Insights Understand preferences & behaviors Predictive Capabilities Anticipate future trends Competitive Advantage Gain market leadership Operational Efficiency Automate and streamline workflows Challenges in Big Data and BI Implementation Data quality and integration issues High storage and processing costs Security and privacy risks Shortage of skilled data professionals Over-dependence on tools without clear strategy However, with cloud-based solutions and AI-powered platforms, these challenges are becoming easier to overcome. Conclusion In the digital era, data is the foundation of success — but only when it’s analyzed effectively. Big Data Analytics gives organizations predictive power, while Business Intelligence delivers clarity and visibility. Together, they transform information into strategic insight, fueling smarter, faster, and data-driven decision-making. Companies embracing this synergy are not just surviving — they’re leading the future of business innovation. FAQs 1. What is the main difference between Big Data Analytics and Business Intelligence?Big Data focuses on analyzing large datasets for predictive insights, while BI focuses on reporting and visualizing historical data. 2. Why are Big Data and BI important?They help businesses make informed decisions, improve efficiency, and predict market trends. 3. What tools are used in Big Data Analytics?Hadoop, Spark, Hive, and Flink are commonly used tools. 4. What are popular BI tools?Power BI, Tableau, QlikView, and Google Data Studio are top BI tools. 5. What skills are needed for Big Data and BI?Data analysis, SQL, Python, visualization tools, and knowledge of databases.

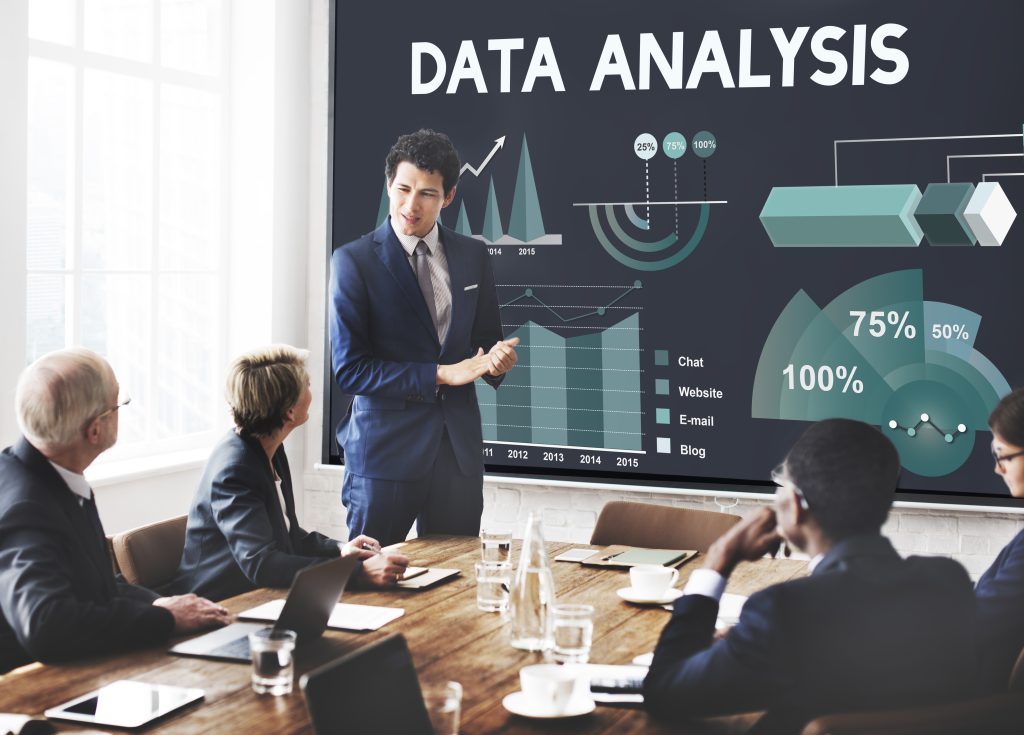
Data analytics dashboard displaying visual graphs and metrics for business performance.
Big Data

Big Data Analytics: Powering Smarter Decisions in the Digital Age

Introduction In the modern world, data is often referred to as the “new oil” — a resource that drives innovation, business growth, and strategic decision-making. However, unlike oil, data’s value depends on how effectively it is analyzed and interpreted. This is where Big Data Analytics comes into play. From personalized recommendations on Netflix to predictive maintenance in manufacturing, Big Data has transformed the way organizations operate. By turning massive volumes of raw data into actionable insights, companies can make faster, smarter, and more confident decisions. In this blog, we’ll explore what Big Data Analytics is, its key components, real-world applications, benefits, challenges, and the future trends shaping this powerful field. What is Big Data Analytics? Big Data Analytics is the process of examining large and complex data sets — often too vast for traditional processing systems — to uncover hidden patterns, correlations, trends, and insights. It involves using advanced technologies like machine learning, artificial intelligence (AI), cloud computing, and data visualization to make sense of massive data generated every second. The 5Vs of Big Data: Volume: The huge amount of data generated from sources like social media, IoT devices, and transactions. Velocity: The speed at which new data is created and needs to be processed. Variety: The different formats of data — structured, semi-structured, and unstructured. Veracity: The reliability and accuracy of data. Value: The insights and business impact derived from analyzing the data. Types of Big Data Analytics Descriptive Analytics: Answers “What happened?” by summarizing historical data (e.g., monthly sales reports). Diagnostic Analytics: Answers “Why did it happen?” by identifying causes and relationships. Predictive Analytics: Answers “What might happen?” using statistical models and forecasting. Prescriptive Analytics: Answers “What should we do next?” by recommending actions based on predictive insights. Together, these analytics types empower organizations to move from hindsight to foresight, enabling smarter business strategies. How Big Data Analytics Works The process involves several key steps: Data Collection: Gathering data from sources such as IoT devices, social media, transactions, and sensors. Data Storage: Using platforms like Hadoop, Apache Spark, or cloud databases to store massive datasets. Data Processing: Cleaning and transforming raw data into usable formats. Data Analysis: Applying algorithms and tools like Python, R, or Power BI to extract insights. Visualization: Presenting data through dashboards and reports to support decision-making. Real-World Applications of Big Data Analytics 1. Healthcare Hospitals and research institutions use Big Data to predict disease outbreaks, personalize treatment plans, and improve patient care.Example: Analyzing patient histories and genetics helps doctors prescribe customized medicines for better outcomes. 2. Retail Retail giants like Amazon and Walmart use analytics to track customer preferences, optimize inventory, and personalize shopping experiences.Example: Big Data predicts buying behavior, allowing targeted ads and product recommendations. 3. Finance Banks and financial institutions use Big Data to detect fraud, assess credit risk, and enhance customer engagement.Example: Real-time fraud detection systems analyze thousands of transactions per second to flag anomalies. 4. Manufacturing Predictive analytics helps manufacturers forecast equipment failures and perform maintenance before breakdowns occur.Example: GE uses Big Data in its “Industrial Internet” to monitor and optimize production equipment globally. 5. Transportation Public and private transport companies analyze data from GPS, sensors, and ticketing systems to improve route efficiency and reduce congestion.Example: Uber uses real-time analytics to match drivers with passengers and set dynamic pricing. 6. Education Educational institutions use data analytics to track student performance, improve learning outcomes, and design adaptive learning programs. Benefits of Big Data Analytics Better Decision-Making: Real-time insights support quick and accurate strategic choices. Operational Efficiency: Identifies inefficiencies and optimizes workflows. Enhanced Customer Experience: Personalizes services based on data-driven behavior analysis. Fraud Detection: Monitors unusual activities and reduces financial risks. Innovation and Competitive Edge: Uncovers new opportunities and emerging market trends. Challenges in Big Data Analytics Data Privacy and Security: Managing sensitive information securely is a major concern. Data Quality Issues: Incomplete or inaccurate data leads to misleading insights. Integration Difficulties: Combining data from multiple systems and formats can be complex. Skill Gaps: There’s a shortage of skilled data analysts and data scientists. Infrastructure Costs: Building and maintaining large-scale data systems can be expensive. Emerging Technologies Shaping the Future of Big Data 1. Artificial Intelligence (AI) and Machine Learning AI automates data processing and enables predictive modeling with higher accuracy. 2. Edge Computing Brings data processing closer to the data source, reducing latency and bandwidth usage. 3. Cloud Analytics Cloud-based solutions make Big Data Analytics more scalable and accessible for businesses of all sizes. 4. Real-Time Analytics Organizations can now act instantly on insights — from fraud detection to dynamic pricing. 5. Data Fabric and Integration Platforms These unify disparate data sources, enabling seamless data sharing across departments. Big Data and Ethics As organizations handle massive amounts of user data, ethical considerations become essential. Businesses must ensure transparency, consent, and fairness in how they collect and analyze data. Implementing strong data governance frameworks and adhering to privacy laws like GDPR and CCPA are vital to maintaining public trust. Conclusion Big Data Analytics is revolutionizing industries, empowering organizations to make data-driven decisions that lead to innovation, efficiency, and growth. As AI, machine learning, and cloud technologies evolve, data analytics will become even more intelligent and accessible. However, success lies in balancing technology with ethical responsibility, ensuring that the power of data serves humanity positively. In the coming years, companies that embrace Big Data Analytics will not just predict the future — they’ll help create it. FAQs 1. What is Big Data Analytics used for? It’s used to analyze large datasets to uncover insights, trends, and patterns that help organizations make better decisions. 2. Which industries use Big Data Analytics the most? Healthcare, finance, retail, manufacturing, and transportation are leading sectors using Big Data for innovation and optimization. 3. How does Big Data improve business performance? It helps companies understand customer behavior, reduce costs, detect fraud, and predict future trends for better strategic planning. 4. What are the main tools for Big Data Analytics? Popular tools include Apache Hadoop, Spark, Tableau, Power

Digital business dashboard showing real-time analytics and performance metrics.
Real-Time Visibility

Real-Time Visibility: The Key to Smarter, Faster, and More Informed Decisions

Introduction In today’s fast-moving digital world, every second counts. Businesses can no longer afford to wait hours—or even minutes—for updates on critical operations. Real-time visibility has become a necessity, not a luxury. It provides instant access to live data, helping organizations monitor, track, and make better decisions at every level. What is Real-Time Visibility? Real-time visibility refers to the ability to view and analyze live data from systems, devices, or processes as it happens. It enables decision-makers to instantly understand what’s occurring within their business—whether it’s tracking shipments, monitoring network performance, or observing production efficiency. In simple terms, it’s about knowing what’s happening right now, not just what happened an hour ago. Why Real-Time Visibility Matters Instant Decision-Making:With immediate data access, businesses can respond faster to changes, disruptions, or risks. Operational Efficiency:Real-time monitoring helps identify inefficiencies quickly, allowing teams to act before issues escalate. Enhanced Customer Experience:Companies can provide accurate delivery times, proactive updates, and faster problem resolution. Cost Savings:By preventing errors and optimizing operations, organizations save time, money, and resources. Key Industries Using Real-Time Visibility 1. Supply Chain & Logistics Real-time tracking of shipments through IoT sensors and GPS. Instant alerts on route delays or temperature fluctuations in perishable goods. Improved coordination between suppliers, distributors, and retailers. 2. Manufacturing Monitoring production lines to detect machine failures instantly. Real-time quality control through automated systems. Optimized inventory management by tracking stock levels in real time. 3. Healthcare Live monitoring of patients’ vitals. Real-time updates on medication administration and equipment usage. Faster response to emergencies through connected healthcare systems. 4. Information Technology Real-time visibility into network performance and cybersecurity threats. Instant system health checks and uptime monitoring. Quick detection of server or application issues. Technologies Behind Real-Time Visibility Internet of Things (IoT): Enables sensors and devices to share live data. Cloud Computing: Allows real-time data processing and storage accessible anywhere. Artificial Intelligence (AI) & Machine Learning (ML): Automates analysis of large datasets instantly. Blockchain: Provides transparent, tamper-proof data sharing. Data Dashboards & Analytics Tools: Help visualize live insights for faster action. Benefits of Implementing Real-Time Visibility Benefit Impact Faster response to disruptions Reduced downtime and better service delivery Improved forecasting Data-driven planning and decision-making Transparency Builds trust with customers and stakeholders Compliance Easier tracking and audit readiness Challenges in Achieving Real-Time Visibility While the benefits are clear, implementing real-time visibility comes with challenges: Data Overload: Managing huge volumes of live data can be complex. Integration Issues: Connecting multiple systems and platforms seamlessly. Security Concerns: Protecting sensitive real-time data from cyber threats. High Initial Costs: Investment in technology and infrastructure. Future of Real-Time Visibility The future is intelligent and connected. With advancements in AI-driven analytics, 5G networks, and edge computing, real-time visibility will become faster and more accurate. Businesses that embrace it will gain a competitive edge by turning instant insights into powerful actions. Conclusion In a world where speed and accuracy define success, real-time visibility stands as a game changer. Whether in logistics, healthcare, IT, or manufacturing, it enables organizations to stay proactive, informed, and agile. Embracing this technology today means being prepared for the challenges of tomorrow. Frequently Asked Questions (FAQs)   1. What does real-time visibility mean? Answer: Real-time visibility refers to the ability to access and monitor live data from systems, devices, or business operations as it happens. It helps organizations make instant decisions, detect issues early, and improve efficiency. 2. Why is real-time visibility important for businesses? Answer: It enables companies to act proactively instead of reactively. With real-time data, businesses can identify bottlenecks, optimize performance, improve customer experience, and reduce costs. 3. Which industries benefit most from real-time visibility? Answer: Industries such as supply chain and logistics, manufacturing, healthcare, retail, and IT operations benefit greatly from real-time visibility. It allows them to track assets, monitor systems, and respond to issues instantly. 4. What technologies enable real-time visibility? Answer: Technologies like IoT (Internet of Things), cloud computing, AI and machine learning, blockchain, and real-time analytics dashboards are key enablers of real-time visibility systems. 5. What are the main challenges in implementing real-time visibility? Answer: The primary challenges include data overload, integration of multiple systems, data security concerns, and high initial setup costs for technology infrastructure. 6. How does real-time visibility improve customer satisfaction? Answer: By providing live updates, accurate tracking, and quick responses, businesses can enhance transparency and build trust with their customers—leading to higher satisfaction and loyalty. 7. What is the future of real-time visibility? Answer: With advancements in 5G, AI-driven analytics, and edge computing, the future of real-time visibility will be even faster, smarter, and more integrated across global systems.

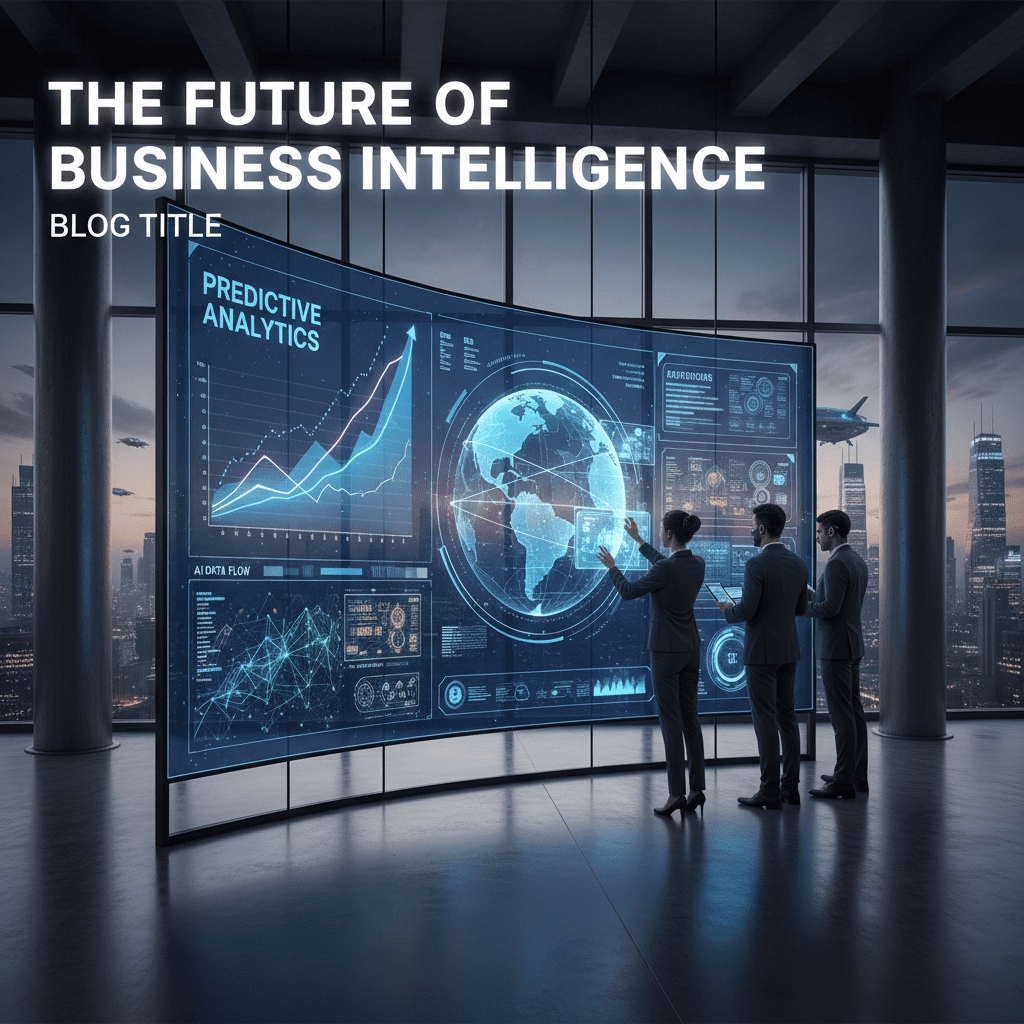
"Futuristic dashboard with predictive analytics graphs, AI data streams, and business professionals analyzing digital interfaces, representing software-driven business forecasting."
data science, Software development

Predictive Analytics Software Development

Introduction Predictive analytics software development is revolutionizing how organizations leverage their data to anticipate trends, reduce risk, and gain a competitive edge. By deploying machine learning, statistics, and advanced modeling, companies can turn historical and real-time data into actionable predictions—whether for sales forecasting, preventing fraud, or optimizing inventory. With mounting business complexity and data volumes, predictive analytics tools have become essential for organizations aiming to future-proof their strategies and drive smart decisions in an ever-changing market. What Is Predictive Analytics Software Development? Predictive analytics utilizes historical and live data, advanced algorithms, and machine learning to forecast future outcomes and recommend the best actions. Developing predictive analytics software typically involves identifying business needs, collecting and preparing data, building models, and integrating these models seamlessly into business applications for real-time insights. Modern predictive analytics systems can be custom-coded, built using data science tools, or integrated through user-friendly low-code platforms, making this technology accessible across industries. Key Features: Automated data ingestion and cleansing Model building, evaluation, and deployment Real-time prediction capabilities Integration with business processes and dashboards Ability to learn and adapt as new data arrives The Predictive Analytics Software Development Lifecycle Strategic Planning Define specific business problems such as churn prediction, fraud detection, or inventory optimization. Set measurable goals and align key stakeholders. Data Collection & Preparation Gather data from internal systems, external sources, and real-time feeds. Cleanse, transform, and annotate data to ensure quality input for models. Model Development Choose appropriate algorithms (e.g., regression, decision trees, neural networks). Train and validate models on historical data; iterate for accuracy and explainability. Integration & Deployment Embed predictive models into business systems like CRMs, ERPs, or supply chain tools for live predictions. Provide end-users, analysts, and leaders with intuitive dashboards or automated triggers. Monitoring, Maintenance, and Scaling Track accuracy; retrain models as conditions shift and new data is available. Continuously enhance with new features and data sources. Best Practices: Start small with a pilot project—optimize, then scale Prioritize data quality and governance early on Foster teamwork between IT, data science, and business units Focus on model transparency and compliance Embrace agile, iterative development for adaptability Business Benefits & Use Cases Improved Decision-Making: Predictive analytics drives proactive strategies by uncovering patterns and forecasting potential outcomes. Risk Reduction: Banks, insurers, and manufacturers leverage predictive models for fraud detection, credit scoring, risk assessment, and predictive maintenance. Enhanced Efficiency: Automated forecasting and resource allocation improve supply chain and operations management. Personalization: Retailers and marketers optimize targeting, recommendations, and retention using behavioral analytics. Healthcare: Early disease detection, readmission risk prediction, and personalized treatment planning lead to improved patient outcomes. Scalable Growth: Predictive software enables organizations to handle increasing data complexity and maintain a competitive edge. Conclusion Developing predictive analytics software equips organizations with the foresight to make smarter, data-driven decisions while automating processes and enhancing resiliency. By following best practices and leveraging modern development frameworks, businesses of all sizes can turn raw data into predictive power—unlocking new opportunities and sustainable growth. Call-to-Action: Explore predictive analytics software solutions tailored to your business needs—connect with expert developers today and turn your data into a strategic asset! FAQ What is predictive analytics software? It is a tool that uses historical and current data, along with algorithms and machine learning, to forecast future trends and inform smarter business decisions. How does predictive analytics benefit companies? It improves revenue prediction, reduces risk, enhances customer experience, streamlines operations, and delivers personalized recommendations. What are common use cases? Fraud detection, demand forecasting, maintenance planning, customer segmentation, and healthcare diagnosis are among the top applications. What is needed to build predictive analytics software? You need a well-defined problem, quality data, an experienced team, the right algorithms, and a plan for ongoing monitoring and refinement. How do you choose the right predictive model? Select based on the type of prediction needed—classification, regression, or time series—and evaluate with validation metrics before deployment

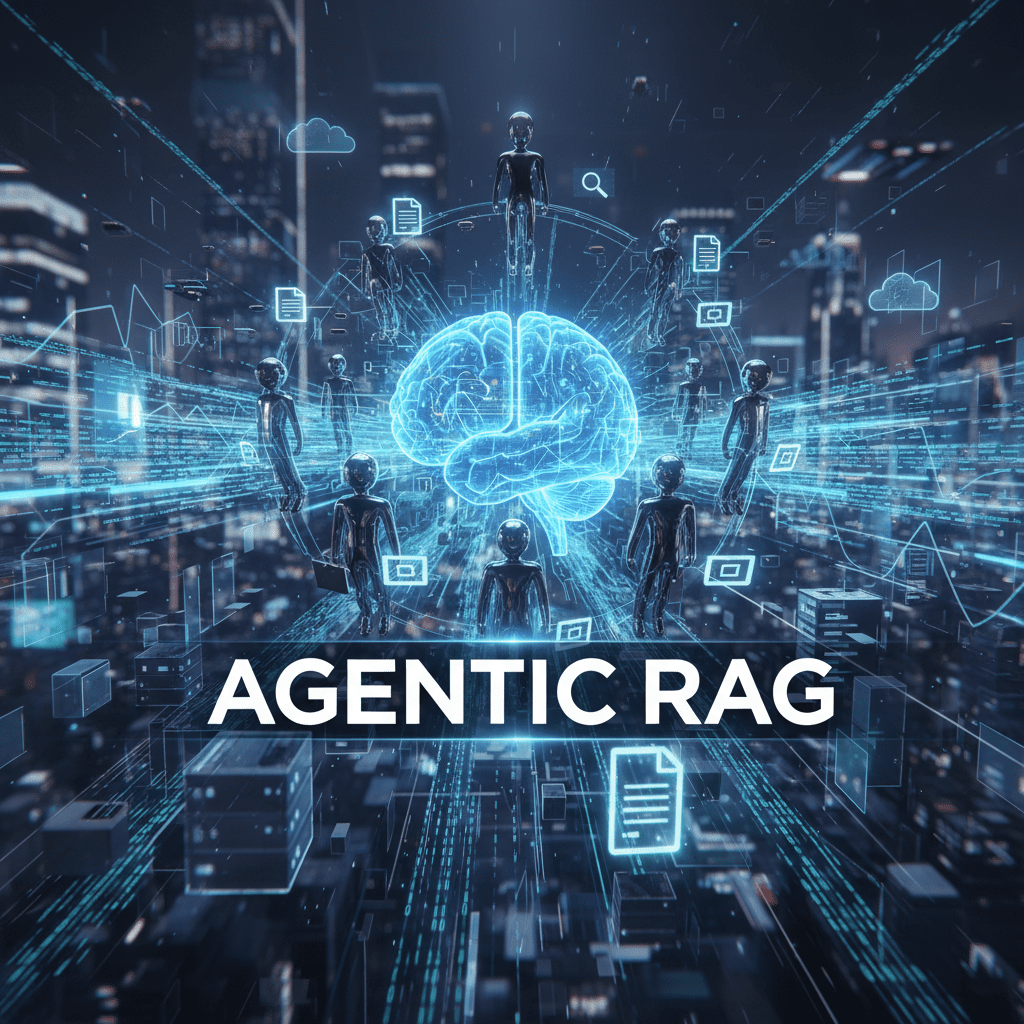
Futuristic business illustration showing a central AI brain connected to digital agent nodes and data streams, with document icons symbolizing smart retrieval. Bold title reads 'Agentic RAG
React native doveploment

Agentic RAG

Introduction Agentic RAG is transforming the way organizations approach information retrieval, research, and automation by combining the power of retrieval-augmented generation (RAG) with intelligent, autonomous agents. This advanced AI framework empowers systems to reason, plan, use external tools, and learn over time, resulting in highly accurate and context-aware outputs. As modern enterprises face exponential growth in data, agentic RAG offers new ways to access reliable information, automate workflows, and create advanced virtual assistants—ushering in a new era of scalable, adaptive business intelligence. What Is Agentic RAG? Agentic RAG merges retrieval-based AI models with generative language models, empowered by autonomous agents that go beyond static query matching. Agents can decide what information to retrieve, break down complex queries into sub-tasks, access external APIs, and synthesize data for comprehensive responses. Unlike classic RAG, agentic RAG adapts to new data and context dynamically, leveraging iterative planning and feedback to continually improve output quality. Key Features: Autonomous decision-making and reasoning Multi-step planning and query decomposition Dynamic retrieval from diverse sources (databases, APIs, knowledge bases) Enhanced accuracy, efficiency, and real-time adaptability Continual learning and context management Types of Agentic RAG Agentic RAG systems employ several types of agents based on function and complexity: Routing Agent: Directs queries to the most suitable RAG pipeline, using agentic reasoning to analyze tasks such as document summarization or question answering. One-Shot Query Planning Agent: Breaks queries into independent sub-queries, executes them in parallel, and synthesizes unified answers. Tool Use Agent: Integrates external tools and APIs for real-time or specialized data, enhancing generative responses. ReAct Agent (Reason + Act): Iteratively reasons and interacts with multiple sources or tools, adapting its approach mid-task for the most precise result. Dynamic Planning & Execution Agent: Manages multi-step and complex workflows, separating long-term plans from immediate execution. Utilizes computational graphs and orchestrates stepwise execution. Applications in Real-World Scenarios Agentic RAG offers transformative benefits across industries: Enterprise Knowledge Management: Streamlines access to organizational data, enabling employees to make fast, informed decisions. Automated Support & Virtual Assistants: Reduces workloads by providing instant, context-relevant answers in customer and employee support. Healthcare: Improves patient insights and research capabilities with agents that gather and contextualize medical knowledge. Legal Research & Finance: Accelerates analysis of documents, regulations, and market data with agents capable of domain-specific data synthesis. Innovation & Research: Assists in synthesizing ideas, comparing multiple sources, and driving strategic initiatives through intelligent information retrieval. How To Implement Agentic RAG Follow these steps for building an agentic RAG system: Define Objectives: Identify tasks suitable for agentic RAG, such as chatbots or automated research. Choose Core Components: Select a retrieval system (e.g., dense passage retrieval, hybrid search) and a generative AI model (e.g., GPT, BERT). Prepare Data: Collect, clean, and preprocess documents to ensure compatibility and maximize retrieval accuracy. Build the Retrieval Layer: Index documents for fast, context-aware search. Agent Integration: Introduce agents to orchestrate workflows—query planning, tool use, and multimodal integration. Fine-Tune & Feedback Loops: Continuously refine models with user feedback and retraining to maintain high performance. Deploy & Monitor: Set up APIs, real-time monitoring, and performance dashboards for ongoing optimization. Key Tools: LlamaIndex and LangChain for agent orchestration, reasoned workflows, and tool integration. Low-code platforms like ZBrain for business workflows and rapid issue response. Conclusion Agentic RAG is redefining the landscape of AI-driven knowledge management, automating complex information retrieval, and powering scalable enterprise solutions. Its combination of multi-agent intelligence, context-awareness, dynamic adaptation, and modular flexibility gives organizations the tools to succeed in an information-rich, rapidly evolving market. Unlock the power of agentic RAG to supercharge research, virtual assistants, and automated decision-making. Call-to-Action: Explore how agentic RAG can optimize workflows and revolutionize information access—connect with AI experts today to get started on a future-ready solution! FAQ What is Agentic RAG? Agentic RAG is a framework that empowers AI agents to retrieve and use external information, plan multi-step workflows, and generate intelligent, context-aware responses far beyond classic RAG capabilities. How does it differ from traditional RAG? Agentic RAG adds autonomous reasoning, multi-task orchestration, and external tool use—enabling more accurate and adaptable information synthesis. What are the main benefits for enterprises? Benefits include scalable automation, enhanced data accuracy, personalized user experiences, and efficiency with reduced costs and improved decision quality. What are common implementation challenges? Challenges involve complex system integration, managing data quality, ensuring scalability, and maintaining real-time performance. Which platforms support agentic RAG development? Popular frameworks are LlamaIndex, LangChain, and low-code platforms like ZBrain, offering flexible workflow design and seamless data integration. The Real Benefits of Hiring a React Native App Development Company

Business

Understanding Business Intelligence and Its Importance for Your Organization

Introduction In today’s fast-paced, data-driven business environment, Business Intelligence (BI) has become an indispensable asset for organizations seeking to transform raw data into actionable insights. Business Intelligence empowers companies to make informed decisions, optimize operations, and gain a competitive edge. This blog delves into why BI is crucial for your organization, exploring its benefits, applications, and impact on strategic growth. What Is Business Intelligence? Business Intelligence refers to the technologies, processes, and practices that collect and analyze data to provide meaningful insights. BI systems gather data from various sources, process it, and present it visually through dashboards, reports, and analytics tools, enabling leaders to understand performance, identify trends, and drive better decisions. Why Is Business Intelligence Important for Your Organization? 1. Enhanced Decision-Making with Data-Driven Insights BI replaces guesswork with factual data, enabling executives and teams to make timely, evidence-based decisions. This reduces risks and improves strategic and operational outcomes. 2. Improved Operational Efficiency By providing visibility into processes and detecting inefficiencies, BI helps organizations streamline workflows, reduce costs, and boost productivity across departments. 3. Better Customer Understanding and Targeting BI analyzes customer behavior, preferences, and trends to optimize marketing campaigns, personalize customer experiences, and increase retention. 4. Accurate Performance Monitoring and Benchmarking Organizations can track KPIs in real-time, measure progress against goals, and identify areas needing improvement, facilitating continuous performance optimization. 5. Competitive Advantage and Market Adaptability Timely insights into market trends and competitive positioning allow businesses to innovate rapidly, seize opportunities, and mitigate threats. 6. Scalability and Growth Enablement BI solutions support scalable data analysis, enabling organizations to grow without losing control over their business intelligence capabilities. 7. Streamlined Collaboration and Information Sharing Centralized data platforms enhance cross-functional communication, reduce data silos, and empower employees with role-based access to relevant insights. How Business Intelligence Supports Different Business Functions Sales and Marketing: Analyzing conversion rates, revenue trends, and marketing ROI. Finance: Budget tracking, cash flow analysis, and fraud detection. Human Resources: Employee productivity, payroll management, and satisfaction analysis. Supply Chain: Inventory optimization, vendor analytics, and logistics monitoring. Executive Leadership: Real-time performance dashboards for strategic oversight. The Role of Advanced Technologies in BI Artificial Intelligence and Machine Learning: Enhance predictive analytics and automate insights generation. Blockchain: Ensure data authenticity and secure audit trails. Cloud Computing: Facilitate scalable, real-time data access and collaboration. Discover AI-driven BI strategies and blockchain integration at TechOTD AI Services and TechOTD Blockchain Blog. Implementing an Effective Business Intelligence Strategy Assess Business Needs and Goals: Define clear objectives that BI should support. Collect and Integrate Data: Aggregate data from multiple sources ensuring quality. Choose BI Tools and Platforms: Select solutions aligned with organizational size and complexity. Develop Dashboards and Reports: Create actionable visualizations tailored for users. Train Teams and Foster a Data Culture: Empower employees to leverage BI in daily workflows. Monitor, Update and Evolve: Continuously refine BI processes based on feedback and changing needs. Conclusion Business Intelligence is not just a tool but a strategic asset that transforms how organizations operate, compete, and grow. Firms that invest in robust BI systems gain deeper insights, sharper responsiveness, and stronger decision-making capabilities—critical factors in today’s competitive markets.

Scroll to Top