
Business Intelligence

Artificial Intelligence, Business Intelligence, cybersecurity, data science, Digital Transformation, Education

The Digital Colleague: How Agentic AI Will Work as a Coworker Alongside Your Team

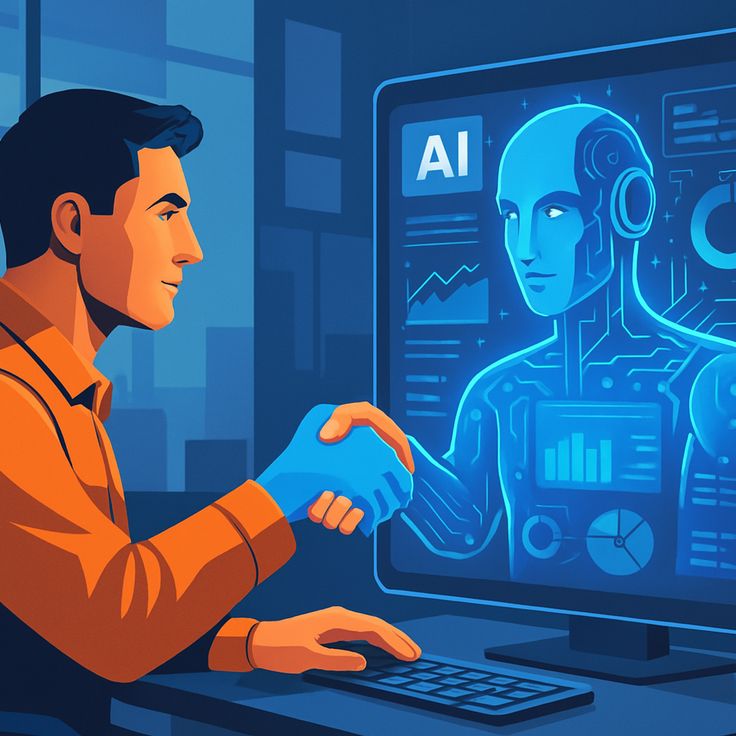
The Digital Colleague: How Agentic AI Will Work as a Coworker Alongside Your Team The Great Shift: From Tools to Teammates For years, we’ve treated Artificial Intelligence like a high-powered calculator or a sophisticated filing cabinet. We gave it a command, it gave us an output. But as we move through 2026, that relationship is fundamentally changing. We are no longer just “using” AI; we are “working with” it. Enter Agentic AI. Unlike the generative AI of 2023 or 2024, which waited for a prompt to act, Agentic AI has agency. It understands goals, plans multi-step processes, and executes them with minimal hand-holding. It doesn’t just write an email; it researches the recipient, checks your calendar for meeting times, drafts the invite, and follows up if there’s no response. This isn’t just automation—it’s a new kind of social contract in the workplace. It’s about moving from “Software as a Service” to “Service as a Colleague.” 1. Understanding the “Agency” in Agentic AI To work effectively with a new coworker, you have to understand how they think. Agentic AI operates on a loop of Reasoning, Planning, and Execution. Reasoning: If you tell a digital colleague, “We need to prep for the Q3 board meeting,” it doesn’t just search for “Q3.” It reasons that a board meeting requires financial reports, project updates, and a slide deck. Planning: It breaks the massive goal into bite-sized tasks. First, it pings the finance agent for the latest spreadsheets. Second, it summarizes the last three months of Jira tickets. Execution: It uses tools. It opens PowerPoint, populates the charts, and leaves a draft in your inbox with a note: “I’ve noticed a slight dip in August productivity—should I add a slide exploring why?” This level of initiative is what transforms AI from a “search bar” into a “seat at the table.” 2. The Human-AI Handshake: Who Does What? The most common fear is replacement, but the reality of 2026 is Augmentation. Think of your team as an orchestra. In the past, the human was the conductor and every single musician. Now, the Agentic AI takes over the “rhythm section”—the repetitive, high-volume, and data-heavy tasks—leaving the human to be the true conductor, focusing on interpretation, emotion, and strategy. Human Strengths (The “Director”): Contextual Nuance: Knowing that a client is going through a merger and needs a softer tone. Ethical Judgment: Deciding if a specific data-driven decision aligns with the company’s core values. Empathy: Managing the morale of the human team. AI Strengths (The “Operator”): Data Synthesis: Reading 1,000 pages of legal documents in seconds to find a single conflict. 24/7 Monitoring: Checking supply chains for disruptions while the rest of the team sleeps. Pattern Recognition: Identifying that a specific software bug always appears when three specific conditions are met. 3. Real-World Scenarios: A Day in the Life of a Hybrid Team Imagine a Marketing Team in 2026. Instead of a manager spending six hours a week on “admin,” they have an AI Agent named “Link.” 9:00 AM: Link scans the morning’s industry news and identifies a trending topic relevant to the brand. 9:30 AM: Link drafts three social media posts and a brief blog outline based on the trend. 10:00 AM: The Human Creative Director reviews Link’s work. They like the data but find the “voice” a bit dry. They ask Link to “Make it more adventurous and focus on the sustainability angle.” 10:05 AM: Link regenerates the content perfectly. It then schedules the posts and begins monitoring engagement in real-time. 4. The Architecture of Trust: How Teams Manage Autonomous Agents One of the biggest hurdles in integrating a digital coworker is the “Trust Gap.” If an agent can make decisions, how do we ensure it doesn’t go rogue or misinterpret a brand’s values? In 2026, this is managed through Instructional Guardrails and Feedback Loops. Defining the Sandbox: Just as you wouldn’t give a new human intern the keys to the corporate bank account on day one, Agentic AI operates within a defined “sandbox.” Managers set spending limits, API access permissions, and approval triggers. The “Human-in-the-Loop” (HITL) Model: This is the gold standard for coworker collaboration. The agent performs the heavy lifting—researching, drafting, and organizing—but pauses for a “Human Handshake” before any external-facing action. Transparent Reasoning: Modern agents now provide a “Chain of Thought.” Instead of just delivering a finished report, your AI coworker can show its work: “I prioritized Project X over Project Y because the Q2 deadline is closer and the resource gap is 15% higher.” This transparency is the foundation of a healthy team dynamic. 5. Re-architecting the Workflow: From “Doing” to “Reviewing” The arrival of Agentic AI requires a fundamental shift in how we structure our workdays. We are moving from a Task-Based Economy to an Outcome-Based Economy. In a traditional setup, a worker’s value was often measured by the hours spent “doing”—typing, coding, or filing. With an agentic coworker, the human’s value shifts toward: Objective Setting: Clearly defining what “success” looks like for the agent. Strategic Refinement: Taking the 80% finished work from the AI and adding the final 20% of “human soul”—the creativity, the empathy, and the unique brand voice. Cross-Functional Orchestration: Coordinating between different AI agents and human departments to ensure everyone is moving toward the same North Star. 6. Overcoming the “Black Box” and Ethical Challenges We cannot talk about AI coworkers without addressing the elephant in the room: Accountability. When an AI agent makes a mistake—perhaps it accidentally uses copyrighted material or misinterprets a data privacy regulation—who is responsible? The 2026 workplace solves this through Algorithmic Accountability Frameworks. Companies are now appointing “AI Orchestrators”—humans whose entire job is to audit, tune, and mentor the company’s fleet of AI agents. This ensures that while the AI has agency, the human remains the ultimate moral and legal authority. 7. The Socio-Economic Impact: Will We Work Less? The goal of the agentic coworker isn’t necessarily to make us work fewer hours, but to make those hours more meaningful. By offloading
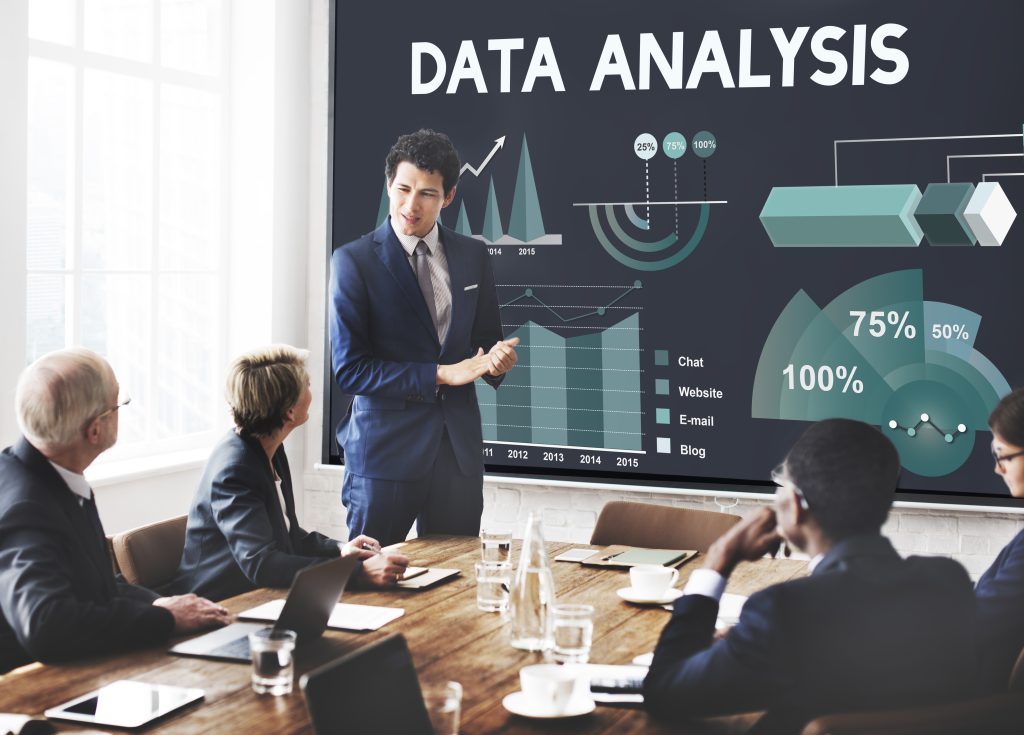
Business Intelligence dashboard visualizing big data analytics trends
Business Intelligence

Big Data Analytics and Business Intelligence: Turning Information into Insight

Introduction In today’s hyper-connected digital world, data is the new oil — a powerful asset that drives innovation, strategy, and growth. Every second, billions of data points are generated from online transactions, social media, IoT devices, and business operations. But raw data is meaningless unless it’s analyzed, interpreted, and used to make informed decisions. That’s where Big Data Analytics and Business Intelligence (BI) come into play. Together, they empower organizations to uncover hidden trends, improve efficiency, and gain a competitive edge in the marketplace. What Is Big Data Analytics? Big Data Analytics is the process of examining large, complex datasets to discover hidden patterns, correlations, market trends, and customer preferences. Unlike traditional data analysis, Big Data Analytics can handle massive volumes (terabytes or petabytes) of structured and unstructured data at lightning speed.  The 5 Vs of Big Data: Volume – Massive amount of data generated daily Velocity – Speed at which data is created and processed Variety – Different formats (text, images, videos, logs, etc.) Veracity – Accuracy and reliability of data Value – Insights gained from analysis By leveraging technologies like Hadoop, Spark, and NoSQL databases, businesses can process and analyze enormous data efficiently. What Is Business Intelligence (BI)? Business Intelligence is a technology-driven process for analyzing data and presenting actionable insights to help executives, managers, and employees make informed business decisions. BI systems typically use dashboards, reports, and visualization tools like: Power BI Tableau QlikView Google Data Studio BI tools collect data from multiple sources, integrate it, and display results through interactive visual dashboards, making insights accessible to everyone. Big Data Analytics vs. Business Intelligence Aspect Big Data Analytics Business Intelligence (BI) Purpose Predict future outcomes Analyze past & present performance Data Type Structured + Unstructured Mostly structured data Tech Used Hadoop, Spark, Machine Learning Power BI, Tableau, SQL Output Predictive & prescriptive insights Descriptive & diagnostic insights Focus Exploration & forecasting Reporting & visualization In short, Big Data Analytics predicts what’s coming next, while Business Intelligence explains what’s happening now. Together, they create a 360° view of the organization, enhancing data-driven strategies. How Big Data and BI Work Together When integrated, Big Data and BI enable organizations to: Collect vast amounts of real-time data Process and store it efficiently Visualize complex patterns Support strategic business decisions Example:A retail company can use Big Data Analytics to predict customer purchase trends and then use BI dashboards to visualize which products are performing best in real-time. Key Components of Big Data and BI Ecosystem 1. Data Collection Data is gathered from multiple sources — sensors, CRM systems, web logs, transactions, and social media. 2. Data Storage Tools like Hadoop Distributed File System (HDFS), Amazon S3, or Google Cloud Storage store massive data volumes securely. 3. Data Processing Frameworks such as Apache Spark and Flink process the data for analysis. 4. Data Analysis Machine learning algorithms and statistical models identify patterns and trends. 5. Data Visualization BI tools like Power BI or Tableau present the results in interactive dashboards and graphs. Applications of Big Data and BI in Industries  1. Retail & E-Commerce Personalized product recommendations Dynamic pricing based on demand Customer behavior tracking Example:Amazon uses predictive analytics to recommend products, improving sales and customer engagement.  2. Healthcare Predictive diagnosis and treatment plans Disease outbreak tracking Patient data management Example:Hospitals use BI tools to monitor patient recovery and resource allocation. 3. Finance Fraud detection using real-time analytics Credit risk assessment Algorithmic trading Example:Banks use Big Data to identify suspicious transactions within seconds. 4. Manufacturing Predictive maintenance of equipment Supply chain optimization Quality control automation 5. Education Performance analytics for students Personalized learning paths Data-driven decision-making in administration Emerging Trends in Big Data and BI Artificial Intelligence Integration:Machine learning models now automate insights generation. Real-Time Analytics:Instant decision-making with live data streaming. Data Democratization:BI tools make analytics accessible to non-technical users. Augmented Analytics:Combines AI and natural language processing (NLP) for smarter reports. Edge Analytics:Data processing closer to the source for faster outcomes. Data Governance and Privacy:Ensuring compliance with regulations like GDPR and HIPAA. Benefits of Big Data Analytics and BI Benefit Impact Informed Decision-Making Data-backed strategic planning Cost Optimization Identify inefficiencies Customer Insights Understand preferences & behaviors Predictive Capabilities Anticipate future trends Competitive Advantage Gain market leadership Operational Efficiency Automate and streamline workflows Challenges in Big Data and BI Implementation Data quality and integration issues High storage and processing costs Security and privacy risks Shortage of skilled data professionals Over-dependence on tools without clear strategy However, with cloud-based solutions and AI-powered platforms, these challenges are becoming easier to overcome. Conclusion In the digital era, data is the foundation of success — but only when it’s analyzed effectively. Big Data Analytics gives organizations predictive power, while Business Intelligence delivers clarity and visibility. Together, they transform information into strategic insight, fueling smarter, faster, and data-driven decision-making. Companies embracing this synergy are not just surviving — they’re leading the future of business innovation. FAQs 1. What is the main difference between Big Data Analytics and Business Intelligence?Big Data focuses on analyzing large datasets for predictive insights, while BI focuses on reporting and visualizing historical data. 2. Why are Big Data and BI important?They help businesses make informed decisions, improve efficiency, and predict market trends. 3. What tools are used in Big Data Analytics?Hadoop, Spark, Hive, and Flink are commonly used tools. 4. What are popular BI tools?Power BI, Tableau, QlikView, and Google Data Studio are top BI tools. 5. What skills are needed for Big Data and BI?Data analysis, SQL, Python, visualization tools, and knowledge of databases.

Scroll to Top