data integration

Business team analyzing AI-powered demand forecasting dashboards and digital supply chain charts in a modern office setting.
Software development

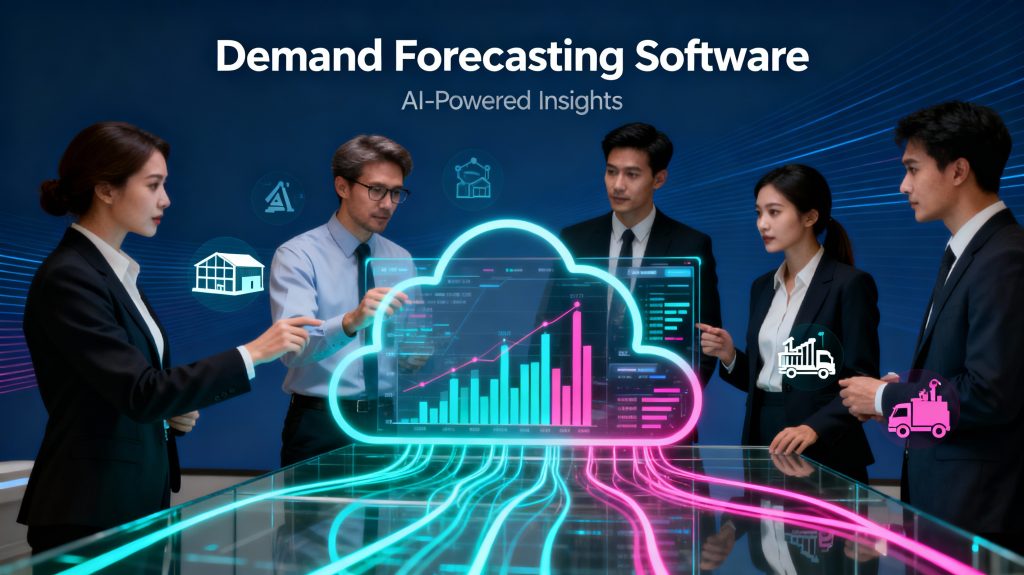
How to Build Demand Forecasting Software

Introduction Demand forecasting software is changing the way businesses predict product demand and optimise inventory. Accurate forecasts help companies reduce costs, improve customer satisfaction, and streamline supply chain management. Building demand forecasting software requires integrating data analytics, machine learning, and seamless system integration. This blog explores essential steps, features, and technologies for developing effective demand forecasting software in 2025. What Is DevOps and Why It Matters in 2025 Key Features of Demand Forecasting Software Data Integration: Connects with ERP, CRM, inventory, sales, and external market data sources for real-time updates.​ Predictive Models: Uses machine learning and statistical algorithms (ARIMA, LSTM, Prophet) to analyse trends, seasonality, and external factors.​ Scenario Planning & What-If Analysis: Allows businesses to simulate effects of price changes, promotional campaigns, or supply disruptions for strategic planning.​ Alerts & Notifications: Automated alerts for significant demand shifts or anomalies ensure proactive management.​ Customizable Dashboards: Tailored interfaces for different departments and decision makers to access relevant insights.​ Cloud-Based & Scalable: Enables remote access, large-scale data handling, and fast updates.​ Steps to Build Demand Forecasting Software Define Objectives and Requirements: Clarify goals like improving accuracy, automation level, and integration needs with existing systems.​ Data Collection and Preprocessing: Gather internal data (sales, inventory, CRM) and external market info, clean and normalize for analysis.​ Select Forecasting Models and Algorithms: Choose suitable predictive models (e.g., ML-based, statistical models) that match business domain and data characteristics.​ Design Software Architecture: Develop modules for data processing, model training, forecasting, alerts, and reporting with scalability in mind.​ Implementation & Integration: Build backend services, frontend dashboards, and connect with ERP/Sales systems using APIs.​ Testing & Validation: Validate model accuracy with historical and real-time data; simulate scenarios and optimize performance.​ Deployment and User Training: Roll out software with training sessions and support to ensure adoption and feedback loops.​ Benefits of Demand Forecasting Software Reduced Inventory Costs: Optimize stock levels to minimize carrying and shortage costs.​ Improved Operational Efficiency: Facilitate better production planning and resource allocation.​ Enhanced Customer Service: Meet demand timely by avoiding stockouts and delays.​ Strategic Business Decisions: Utilize scenario analysis to foresee market changes and plan effectively.​ Realtime Adaptation: Quickly respond to market shifts with alerts and updated forecasts.​ Conclusion Building effective demand forecasting software requires a harmonious blend of data analytics, predictive modeling, and practical system integration. By following methodological steps from defining clear objectives to deployment, businesses can achieve accurate forecasting, reduce costs, and improve operational agility. As 2025 evolves, demand forecasting software powered by AI and real-time data integration becomes an indispensable tool for competitive businesses. FAQ 1. What types of data are needed for demand forecasting software? Sales records, inventory levels, market trends, CRM data, and external economic signals.​ 2. Which machine learning models are commonly used? ARIMA, LSTM, and Facebook Prophet are popular for time-series demand prediction.​ 3. Can demand forecasting software adapt to sudden changes? Yes, advanced solutions provide real-time data integration and anomaly detection for quick adaptation.​ 4. How important is scenario planning? It enables businesses to simulate potential disruptions or changes in conditions, aiding better decision-making.​ 5. Is cloud deployment recommended? Yes, cloud ensures scalability, accessibility, and ease of updates for demand forecasting software.​

Business Intelligence dashboard visualizing big data analytics trends
Business Intelligence

Big Data Analytics and Business Intelligence: Turning Information into Insight

Introduction In today’s hyper-connected digital world, data is the new oil — a powerful asset that drives innovation, strategy, and growth. Every second, billions of data points are generated from online transactions, social media, IoT devices, and business operations. But raw data is meaningless unless it’s analyzed, interpreted, and used to make informed decisions. That’s where Big Data Analytics and Business Intelligence (BI) come into play. Together, they empower organizations to uncover hidden trends, improve efficiency, and gain a competitive edge in the marketplace. What Is Big Data Analytics? Big Data Analytics is the process of examining large, complex datasets to discover hidden patterns, correlations, market trends, and customer preferences. Unlike traditional data analysis, Big Data Analytics can handle massive volumes (terabytes or petabytes) of structured and unstructured data at lightning speed.  The 5 Vs of Big Data: Volume – Massive amount of data generated daily Velocity – Speed at which data is created and processed Variety – Different formats (text, images, videos, logs, etc.) Veracity – Accuracy and reliability of data Value – Insights gained from analysis By leveraging technologies like Hadoop, Spark, and NoSQL databases, businesses can process and analyze enormous data efficiently. What Is Business Intelligence (BI)? Business Intelligence is a technology-driven process for analyzing data and presenting actionable insights to help executives, managers, and employees make informed business decisions. BI systems typically use dashboards, reports, and visualization tools like: Power BI Tableau QlikView Google Data Studio BI tools collect data from multiple sources, integrate it, and display results through interactive visual dashboards, making insights accessible to everyone. Big Data Analytics vs. Business Intelligence Aspect Big Data Analytics Business Intelligence (BI) Purpose Predict future outcomes Analyze past & present performance Data Type Structured + Unstructured Mostly structured data Tech Used Hadoop, Spark, Machine Learning Power BI, Tableau, SQL Output Predictive & prescriptive insights Descriptive & diagnostic insights Focus Exploration & forecasting Reporting & visualization In short, Big Data Analytics predicts what’s coming next, while Business Intelligence explains what’s happening now. Together, they create a 360° view of the organization, enhancing data-driven strategies. How Big Data and BI Work Together When integrated, Big Data and BI enable organizations to: Collect vast amounts of real-time data Process and store it efficiently Visualize complex patterns Support strategic business decisions Example:A retail company can use Big Data Analytics to predict customer purchase trends and then use BI dashboards to visualize which products are performing best in real-time. Key Components of Big Data and BI Ecosystem 1. Data Collection Data is gathered from multiple sources — sensors, CRM systems, web logs, transactions, and social media. 2. Data Storage Tools like Hadoop Distributed File System (HDFS), Amazon S3, or Google Cloud Storage store massive data volumes securely. 3. Data Processing Frameworks such as Apache Spark and Flink process the data for analysis. 4. Data Analysis Machine learning algorithms and statistical models identify patterns and trends. 5. Data Visualization BI tools like Power BI or Tableau present the results in interactive dashboards and graphs. Applications of Big Data and BI in Industries  1. Retail & E-Commerce Personalized product recommendations Dynamic pricing based on demand Customer behavior tracking Example:Amazon uses predictive analytics to recommend products, improving sales and customer engagement.  2. Healthcare Predictive diagnosis and treatment plans Disease outbreak tracking Patient data management Example:Hospitals use BI tools to monitor patient recovery and resource allocation. 3. Finance Fraud detection using real-time analytics Credit risk assessment Algorithmic trading Example:Banks use Big Data to identify suspicious transactions within seconds. 4. Manufacturing Predictive maintenance of equipment Supply chain optimization Quality control automation 5. Education Performance analytics for students Personalized learning paths Data-driven decision-making in administration Emerging Trends in Big Data and BI Artificial Intelligence Integration:Machine learning models now automate insights generation. Real-Time Analytics:Instant decision-making with live data streaming. Data Democratization:BI tools make analytics accessible to non-technical users. Augmented Analytics:Combines AI and natural language processing (NLP) for smarter reports. Edge Analytics:Data processing closer to the source for faster outcomes. Data Governance and Privacy:Ensuring compliance with regulations like GDPR and HIPAA. Benefits of Big Data Analytics and BI Benefit Impact Informed Decision-Making Data-backed strategic planning Cost Optimization Identify inefficiencies Customer Insights Understand preferences & behaviors Predictive Capabilities Anticipate future trends Competitive Advantage Gain market leadership Operational Efficiency Automate and streamline workflows Challenges in Big Data and BI Implementation Data quality and integration issues High storage and processing costs Security and privacy risks Shortage of skilled data professionals Over-dependence on tools without clear strategy However, with cloud-based solutions and AI-powered platforms, these challenges are becoming easier to overcome. Conclusion In the digital era, data is the foundation of success — but only when it’s analyzed effectively. Big Data Analytics gives organizations predictive power, while Business Intelligence delivers clarity and visibility. Together, they transform information into strategic insight, fueling smarter, faster, and data-driven decision-making. Companies embracing this synergy are not just surviving — they’re leading the future of business innovation. FAQs 1. What is the main difference between Big Data Analytics and Business Intelligence?Big Data focuses on analyzing large datasets for predictive insights, while BI focuses on reporting and visualizing historical data. 2. Why are Big Data and BI important?They help businesses make informed decisions, improve efficiency, and predict market trends. 3. What tools are used in Big Data Analytics?Hadoop, Spark, Hive, and Flink are commonly used tools. 4. What are popular BI tools?Power BI, Tableau, QlikView, and Google Data Studio are top BI tools. 5. What skills are needed for Big Data and BI?Data analysis, SQL, Python, visualization tools, and knowledge of databases.

enterprice

Building a Robust Enterprise Data Strategy: Benefits, Use Cases, Process, Costs & Best Practices

Introduction In today’s data-driven world, a robust enterprise data strategy is essential for organizations seeking to unlock the full potential of their data assets. It provides a comprehensive roadmap for managing, governing, and leveraging data to drive innovation, improve decision-making, ensure compliance, and gain a competitive advantage. This blog explores the benefits, use cases, key processes, costs, and best practices involved in building an effective enterprise data strategy. For further insights into AI-powered data solutions and digital transformation, visit TechOTD’s AI Services and explore their technology blog. Benefits of a Robust Enterprise Data Strategy Informed Decision-Making: Having reliable, consistent data reduces errors and enables rapid, strategic business choices across all organizational levels. Improved Operational Efficiency: Streamlining data access and integration eliminates duplication and redundant manual efforts, allowing employees to focus on value-added tasks. Regulatory Compliance & Risk Management: Implementing governance frameworks ensures compliance with critical regulations such as GDPR, HIPAA, and PCI-DSS, minimizing costly penalties and protecting customer privacy. Enhanced Customer Experience: Organizations gain a 360-degree customer view with unified data, enabling personalization, targeted marketing, and superior service. Data Security and Risk Mitigation: Strong data security policies protect sensitive information from unauthorized access and data breaches. Scalability and Future-Readiness: A good data strategy builds scalable infrastructure that adapts easily to growing data and emerging technologies. Cost Savings: Reducing redundant systems and improving data quality lowers overall IT costs and operational expenses. Use Cases for Enterprise Data Strategy Customer Analytics and Personalization: Tailoring marketing campaigns and services based on unified customer data insights. Fraud Detection and Risk Assessment: Combining real-time data streams across departments for proactive fraud prevention. Predictive Maintenance: Leveraging data to predict failures and reduce downtime in manufacturing and operations. Regulatory Reporting and Audit Readiness: Automated data lineage and governance ensure smooth compliance reporting. Product and Market Innovation: Data-driven R&D accelerates new product development and market adaptation. The Process of Building an Enterprise Data Strategy Planning and Goal Setting: Align data strategy objectives with business goals such as reducing churn, speeding time-to-market, or enhancing customer satisfaction. Current State Assessment: Audit existing data systems to identify redundancies, quality issues, and shadow IT. Future State Vision: Define the ideal “trusted, scalable, and compliant” data environment tailored to business needs. Roadmap Development: Develop structured implementation plans prioritizing quick wins and strategic initiatives. Implementation: Deploy governance, data quality, integration, and security processes aligned with roadmap milestones. Monitoring and Continuous Improvement: Track adoption metrics, data quality, and compliance, refining strategy as business evolves. Cost of Enterprise Data Strategy The investment varies widely based on scale, complexity, industry regulations, and existing infrastructure. Key cost drivers include: Integration and Migration: Consolidating legacy systems and data silos can consume 40-50% of initial budgets. Technology and Tools: Cloud platforms offer flexible spending models; on-premises solutions require higher upfront costs. Governance and Training: Developing policies, training personnel, and managing compliance are ongoing investments. Talent: Skilled data engineers, scientists, and governance experts are essential and can be a significant expense. Many organizations allocate between 3-6% of their IT budget to data strategy-related initiatives. Best Practices Start with High-Value Use Cases: Focus on domains with measurable ROI to build momentum. Invest in Data Lineage Early: Trace and document data origins to boost trust and audit readiness. Integrate Compliance into Pipelines: Address privacy and security during data ingestion, not as an afterthought. Balance Governance with Innovation: Create “innovation zones” for experimental AI or data products without sacrificing control. Prioritize Metadata Management: Catalog and document data thoroughly for easy discovery and security. Measure Adoption, Not Just Implementation: Encourage culture shifts through training, metrics, and leadership incentives. Design for Change: Utilize modular architectures anticipating evolving regulations and technologies. How TechOTD Supports Enterprise Data Strategy At TechOTD, we combine AI expertise, cloud infrastructure, and agile methodologies to build tailored enterprise data strategies that enhance operational resilience and unlock growth opportunities. Learn more about our mobile app and AI services. Conclusion A robust enterprise data strategy is vital to navigate today’s complex data landscape and drive sustainable business success. By aligning data initiatives with business goals, embedding governance and compliance, and prioritizing scalability and adoption, organizations can unlock significant value from their data assets. Partnering with experts like TechOTD ensures a structured, effective implementation that powers innovation and competitive advantage. Explore the latest trends and insights in data strategy and AI on the TechOTD Blog. FAQs Q1: What is an enterprise data strategy? A plan that aligns data management, governance, and analytics capabilities with business objectives to maximize data value. Q2: How does a data strategy improve operational efficiency? By reducing data silos, duplication, and manual errors, enabling faster, informed decision-making. Q3: What industries benefit most from enterprise data strategies? Finance, healthcare, retail, manufacturing, and telecom are leading adopters due to heavy data use and regulation. Q4: Can AI be integrated with an enterprise data strategy? Yes, clean, governed data is essential to drive AI and machine learning initiatives effectively. Q5: How much does an enterprise data strategy cost? The investment varies, but companies typically allocate 3-6% of their IT budgets toward data strategy initiatives.

How would you like me to respond?

Select a personality for your AI assistant

Normal
Happy
Sad
Angry

Your selection will affect how the AI assistant responds to your messages

Chat Assistant

Let's discuss your project!

Hear from our clients and why 3000+ businesses trust TechOTD

Tell us what you need, and we'll get back with a cost and timeline estimate

Scroll to Top